Overtrading is not a number of trades. A scalper taking sixty trades a day is working; a swing trader taking six is probably in trouble. It is about whether the trades came from your plan or from the previous trade.
1. Time since the last loss
The most revealing number in any journal, and almost nobody looks at it. For each trade, measure the gap between it and the previous losing trade.
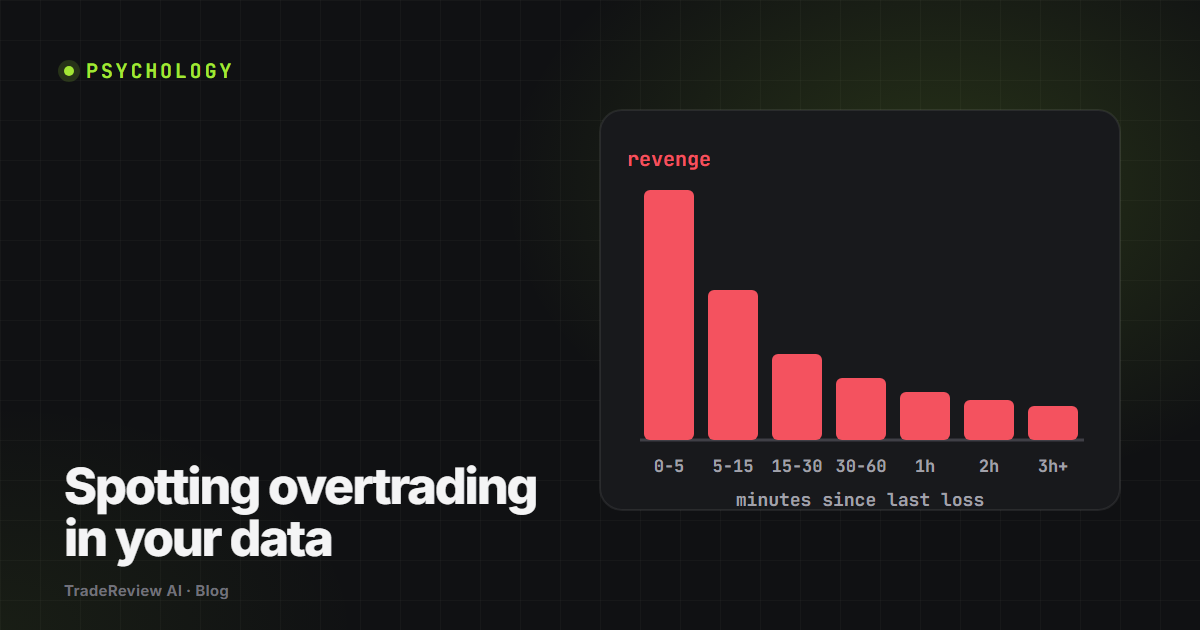
Plot the results. A healthy distribution is spread out. An unhealthy one has a spike in the first five minutes - and those trades, as a group, almost always have a worse expectancy than the rest of your trading. That cluster is revenge trading, and it is measurable rather than a matter of opinion.
2. Size after a loss
Compare your average position size on trades following a loss with your average overall. If the first number is higher, you are increasing risk at the moment your judgement is worst.
This one is worth checking even if your results look fine. It is the habit that turns a bad day into a bad month.
3. Trades per day against results per day
Group your days by trade count and look at the average result for each group. Most active traders find a cliff: results hold up to a certain number of trades a day and fall off sharply past it.
That number is personal and usually lower than expected - often four to six for discretionary day traders. Once you know yours, it becomes a rule you can actually enforce, because it came from your own data rather than from advice.
4. Share of trades that match a setup
Tag every trade with the setup it came from. The trades you cannot tag - the ones that end up as "other" - are the honest measure of how much of your trading is improvised.
If 30% of your trades have no setup, you do not have a discipline problem to fix in general. You have thirty percent of your trades to stop taking, which is a much more actionable thing.
What actually stops it
Rules that work are specific, measurable and decided in advance:
- A hard trade count. After your number, the platform closes. Not "be more selective".
- A cooling-off period. No new entry within a set number of minutes of a losing exit. This single rule removes most of the first-five-minutes cluster.
- A daily stop in money. Reached, you are done, regardless of what the chart is doing.
All three share a property: they do not require you to assess your own state of mind at the moment you are least able to.
Journal prompts
- What is my expectancy on trades taken within five minutes of a loss, versus all other trades?
- At what daily trade count do my results start falling?
- What percentage of my trades have no setup tag?