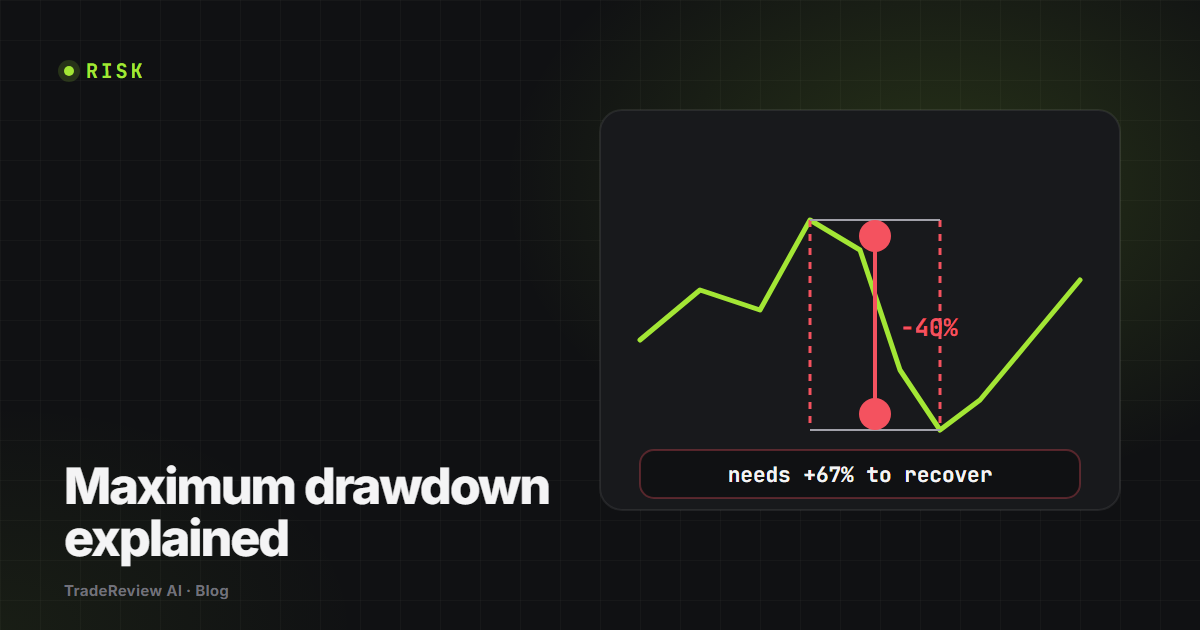
Maximum drawdown is the largest peak-to-trough fall your account has made. If you ran up to $12,000 and then fell to $9,600 before making a new high, your maximum drawdown is $2,400, or 20%.
The recovery maths
Losses and gains are not symmetrical, because a loss shrinks the base that the next gain is calculated on.
| Drawdown | Gain needed to recover |
|---|---|
| 10% | 11% |
| 20% | 25% |
| 30% | 43% |
| 40% | 67% |
| 50% | 100% |
| 70% | 233% |
The formula is recovery = drawdown ÷ (1 − drawdown). Below about 20% the penalty is mild. Past 30% it turns vicious, and past 50% you are no longer trading your strategy - you are trying to make a once-in-a-career return just to get back to where you started.
What is an acceptable maximum drawdown?
There is no universal number, but there are useful reference points:
- Under 10% - conservative, and typical of someone risking well under 1% per trade.
- 10 to 20% - normal for an active retail trader with a genuine edge.
- 20 to 30% - survivable, but you should be able to point at what caused it.
- Over 30% - the strategy, the sizing, or the discipline has a problem. Usually the sizing.
The more useful question is not "what is my maximum drawdown" but "what caused it". A 25% drawdown spread across forty small losses is a strategy going through a rough patch. The same 25% from three trades is a sizing failure wearing a strategy's clothes.
Daily drawdown is a different animal
Maximum drawdown is measured from your highest point ever. Daily drawdown resets every session, and on a prop firm account it is usually the rule that ends you - not because it is tighter, but because it is reached faster. Three stop-outs in the first hour can hit a daily limit that a month of normal trading would never approach.
If you are on an evaluation, you need both numbers in front of you during the session. Working them out afterwards tells you why you failed, which is not the same as not failing.
Drawdown has a shape, and the shape matters
Two accounts can both show a 20% maximum drawdown and be in completely different health:
- One deep, slow drawdown that recovered over three months - a strategy out of phase with the market.
- Several sharp drawdowns within single days, each recovered quickly - usually revenge trading, and the equity curve hides it because the days close flat.
The second one is more dangerous and far easier to miss, because month-end numbers look fine. You only see it by looking at intraday behaviour: how many trades you took after a loss, and how big they were.
Journal prompts
- What is my maximum drawdown, and which trades caused it?
- How many separate trades made up my worst drawdown - three, or thirty?
- What is my worst single day, and what happened in the hour before it?