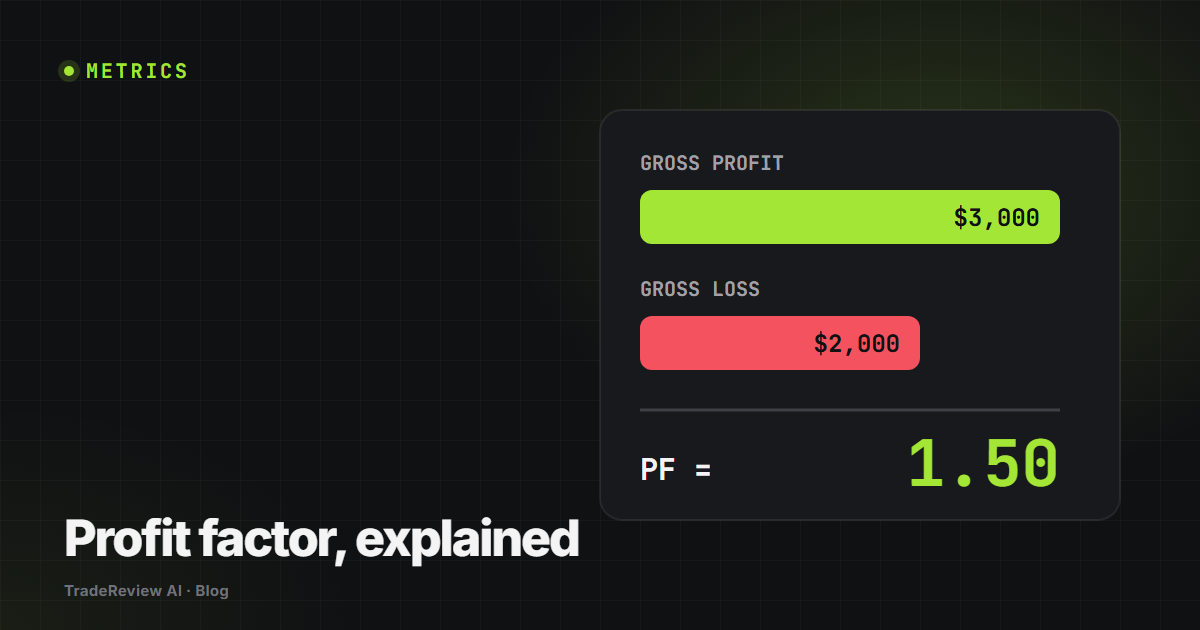
Win rate gets all the attention, but it says nothing about size. A strategy that wins 80% of the time can still lose money if the losers are big enough. Profit factor puts wins and losses on the same scale.
The formula
Profit factor = gross profit ÷ gross loss
Gross profit is the total of every winning trade. Gross loss is the total of every losing trade, written as a positive number. Include commissions and fees in both, or the number flatters you.
Example: over a month your winners add up to $3,000 and your losers add up to $2,000. Profit factor is 3,000 ÷ 2,000 = 1.5. For every $1 lost, you made $1.50.
What is a good profit factor?
- Below 1.0: the strategy loses money. Losses outweigh wins.
- 1.0 to 1.3: barely profitable. A little more slippage, a few more fees or one bad week can wipe it out.
- 1.3 to 2.0: a workable edge for most active traders, as long as the sample is large enough to trust.
- Above 2.0: strong. Above 3.0, check the sample first. A handful of trades or one outsized winner often explains it.
These ranges are rules of thumb, not a guarantee. What matters most is whether the number holds up as you add trades.
How it connects to win rate
Profit factor can also be written as (win rate × average win) ÷ (loss rate × average loss). That shows the two levers: win more often, or make winners larger than losers. A 40% win rate with winners twice the size of losers gives (0.4 × 2) ÷ (0.6 × 1) = 1.33.
Three ways profit factor lies
- Too few trades. Twenty trades can produce almost any number. Look for at least 50 to 100 before drawing conclusions.
- One giant winner. Remove your single best trade and recalculate. If the edge disappears, you had a lucky trade, not a strategy.
- Mixed setups. One overall number can hide a great setup and a terrible one cancelling out. Calculate profit factor per setup tag.
Journal prompts
- What is my profit factor with fees included?
- What does it become without my best trade?
- Which setup has the highest profit factor, and which is below 1.0?