If an average trade is worth +$25, taking more good trades should make more money. If it is worth −$10, every extra trade digs the hole deeper. Expectancy is how you find out which one you are.
The formula
Expectancy = (win rate × average win) − (loss rate × average loss)
Win rate and loss rate are fractions that add up to 1. Average loss is written as a positive number.
Example in dollars
You win 45% of trades. Average win is $300, average loss is $200.
(0.45 × 300) − (0.55 × 200) = 135 − 110 = +$25 per trade.
Example in R
R is the amount you planned to risk. Measuring in R removes position size from the picture, so trades of different sizes compare fairly.
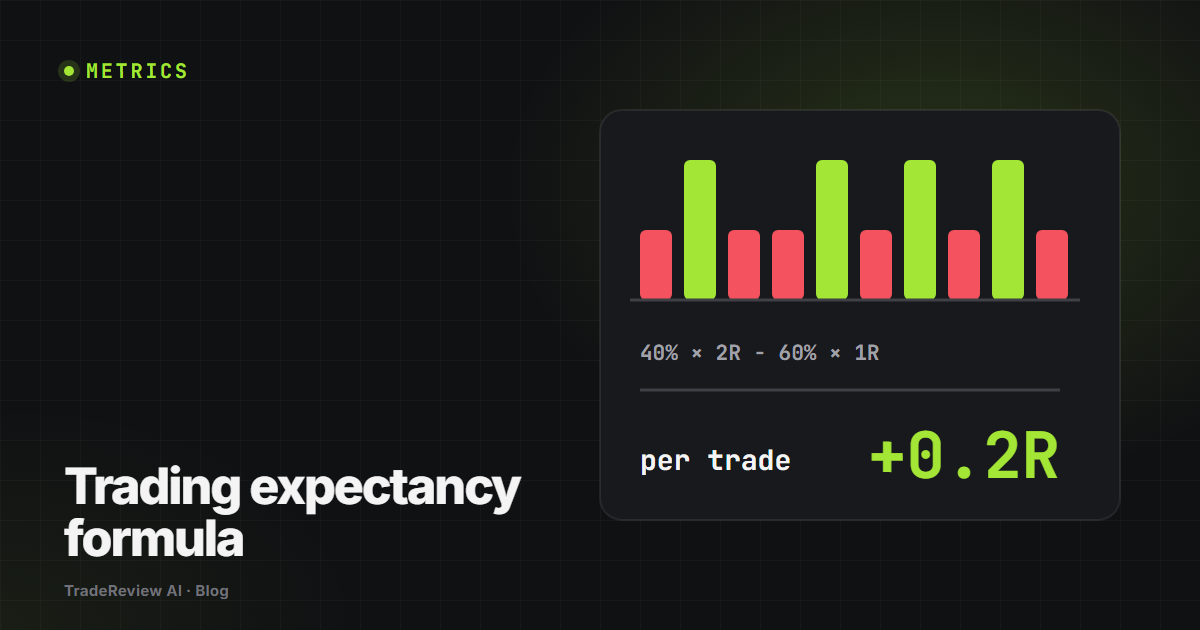
You win 40% of trades, average win is 2R, average loss is 1R.
(0.40 × 2) − (0.60 × 1) = 0.8 − 0.6 = +0.2R per trade. Over 100 trades risking $100 each, that is about 20R, or $2,000, before costs.
Want to try your own numbers? Use the free trading expectancy calculator.
Reading the result
- Positive: the approach makes money on average. Protect it by keeping risk per trade consistent.
- Around zero: fees and slippage will likely push it negative. Look for the setup or time of day dragging it down.
- Negative: more trades means more losses. Cut size or stop trading that setup while you review.
How many trades before you trust it?
Expectancy from 15 trades is mostly noise. Treat it as a rough signal after about 30 trades and a more reliable one after 100. Keep calculating it per setup, because a single blended number hides which setups are carrying you.
Journal prompts
- What is my expectancy in R over the last 50 trades?
- Which setup has negative expectancy?
- Did my expectancy change after I changed my rules?